Week CLXII — Comptroller: Pandemic boosted federal aid to New York but improvement is short-term
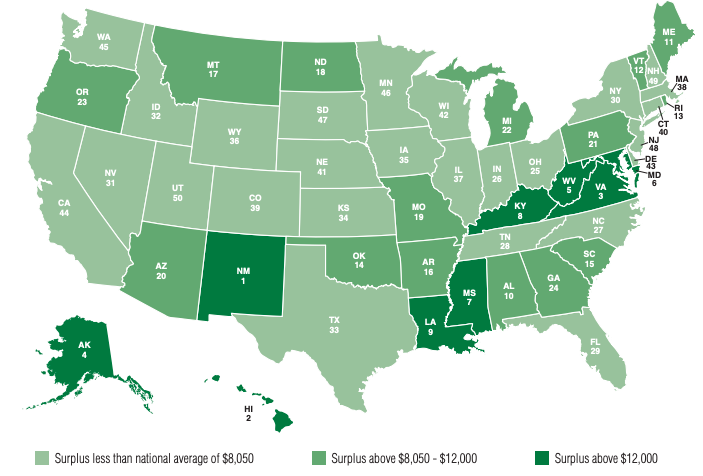
— Map from Office of the NYS Comptroller
For 2021, each state is ranked from number 1 (New Mexico) to number 50 (Utah) with the darker green showing the most favorable balance of payments per capita and the lighter green showing the least favorable. New York, number 30, had a per capita surplus less than the national average of $8,050. New York had ranked 49th in 2019 before pandemic aid.
ALBANY COUNTY — In 2020 and 2021, federal spending increased substantially in response to the COVID-19 pandemic, resulting in a positive balance of payments for all states, according to a report released this week by the state’s comptroller, Thomas DiNapoli.
Each United States resident received on average $8,050 more in federal expenditures on their behalf than they paid in federal taxes, the report says. This contrasts with 2019 and prior years, when New York and a handful of other states had a negative balance of payments with the federal government.
But, while residents, businesses, and governments in New York state collectively received more in federal funds than they paid in taxes, the return on every dollar New York generated in federal tax receipts was $1.51, which was below the national average of $1.70 in 2021.
Of all 50 states, New York had the 30th most favorable balance of payments, said the report, titled “New York’s Balance of Payments in the Federal Budget: Federal Fiscal Year 2021.”
In 2019, before pandemic aid, New York had ranked 49th out of 50 states.
“New York’s per capita ranking jumped because of pandemic funding for fiscal recovery, economic support, Medicaid and vaccine manufacturing contracts,” said DiNapoli in a statement releasing the report. “This significant improvement reflects short-term measures, however, not enduring policy changes. As the temporary aid winds down, the underlying trends are likely to return, with New York reverting to getting far less from Washington than it sends.”
New York received $147.9 billion, or $7,455 per capita, more in federal spending than it paid in total taxes to the federal government in 2021, the report says. On a per capita basis, New York contributed $14,753 to the federal treasury and received $22,208 in federal spending.
Both tax payments and expenditures grew from the prior year: New York generated $292.6 billion compared to $249.5 billion and received $440.5 billion compared to $395.7 billion in 2020, respective increases of about $43 billion and $45 billion, the report says.
New York paid a higher level of total and per capita federal taxes in 2021, ranking third nationally on both measures, according to the report. On a per capita basis, federal tax revenues from New York were 28.6 percent higher than the national average, partly because of taxpayers’ relatively higher incomes.
New York ranked eighth on per capita federal expenditures received in 2021. Compared to 2020, per capita federal spending rose by two-and-a-half times the national average.
Major pandemic-related spending that was higher in New York relative to other states on a per capita basis includes:
— $2,587 per capita for unemployment compensation;
— $1,219 per capita through the Paycheck Protection Program;
— $998 per capita through State and Local Fiscal Recovery Funds;
— $393 per capita in student loan costs from payment waivers; and
— $256 per capita for Restaurant Revitalization and Shuttered Venues Operations.
Federal procurement spending in 2021 in New York increased significantly — $31.4 billion compared to $14.1 in 2020 and $11.9 billion in 2019 — due primarily to large contracts for vaccine manufacture in New York. This shifted New York’s rank in this area from 43rd in 2020 to 17th in 2021.
“New York has historically been a state that experiences a negative balance of payments with the federal government,” the report says. “The impact of federal relief and stimulus in response to COVID-19 on the balance of payments between the states and Washington has clearly been positive for all states, including New York.
“Because this funding is temporary, a return to the spending trends and balance of payments outcomes that were typically experienced prior to the COVID-19 pandemic is probable.”
Slow job recovery for New Yorkers with disabilities
DiNapoli also released a report this week detailing the slow employment recovery from the pandemic for New Yorkers with disabilities.
“The COVID-19 pandemic led to soaring unemployment rates for people with disabilities, and these rates have not declined as quickly in New York as they have nationally,” says the report.
Further, the report says, the national share of people with disabilities who are working reached a new high in 2022, while the share in New York continued to decline from pre-pandemic levels.
Between 2020 and 2022, the report notes, the number of working-age people with disabilities grew 14.4 percent in New York and 10.9 percent nationally.
Unemployment rates for people with disabilities similarly show slower recovery in New York than the nation.
Iin 2019, the unemployment rate for working-age people with a disability was 8.0 percent nationally and 8.8 percent in New York. Unemployment rates for people with disabilities soared in 2020, reaching 13.4 nationally and 13.9 percent in New York.
While the national unemployment rate for people with a disability decreased by 5.2 percentage points between 2020 and 2022, dropping to 8.2 percent, the unemployment rate in New York state continued to increase in 2021 before declining to 11.9 percent in 2022, a rate 3.7 percentage points above the national average.
The report also notes efforts New York has made to increase opportunities for people with disabilities such as creating a training and certification program for employers that have taken the State’s EmployAbility pledge to demonstrate their commitment to inclusive workplaces.
Albany County COVID numbers
For the fourth week in a row, Albany County has been designated by the Centers for Disease Control and Prevention as having a “low” community level of COVID-19.
This follows two months of being labeled “medium,” which followed a month with a “high” designation after just two weeks at “low” preceded by a month of “medium” after 13 weeks of being labeled “high.”
This week again, 58 of New York’s 62 counties are, like Albany, designated as having a “low” community level. Four counties in the Finger Lakes region are again labeled “medium”: Yates, Ontario, Seneca, and Wayne counties.
Nationwide, following a positive trend over the last two-and-a-half months, a little over half of a percent —just 17 counties, up from 13 last week — are labeled “high.” Counties labeled “medium” are down from 5.5 percent last week and 9 percent the week before to just 2.5 percent while those labeled “low” make up a whopping 97 percent.
The weekly metrics the CDC used to determine the current “low” level for Albany County are:
— Albany County now has a case rate of about 20 per 100,000 of population, down from 28 last week, 35 two weeks ago, 30 three weeks ago, 42 four weeks ago, and a steady decrease from 120 twelve weeks ago;
— For the important COVID hospital admission rate, Albany County has a rate of 4.4 per 100,000, down from 6.2 last week, 5.6 two weeks ago, 9.6 three weeks ago and dramatically down from more than quadruple that, 22.2, twelve weeks ago; and
— Albany County now has 2.4 percent of its staffed hospital beds filled with COVID patients, down from 2.9 last week, 4.3 two weeks ago, 5.1 three weeks ago, which had hovered near the same mark for about a month, down from the percentages for the previous eleven weeks, which ranged from 6 to 8.
This week, Albany County’s 162nd of dealing with COVID, numbers are continuing in the right direction with fewer new cases documented. The same is true statewide and nationwide.
Albany County’s dashboard, as of Tuesday, April 18, showed a death toll of 634, the same as last week: 329 females and 305 males.
Also as of April 18, according to Albany County’s COVID dashboard, 11 patients were hospitalized with COVID, the same as last week, down from 16 two weeks ago, 22 three weeks ago, 26 four weeks ago, 30 five weeks ago and 31 patients the week before, which was down from 39 seven weeks ago, near the same mark for a month but down from 42 eleven weeks ago, 43 twelve weeks ago, and 46 thirteen weeks ago.
In New York state, according to the health department’s most recent figures, for samples collected between March 26 and April 8, the Omicron variant continued to make up 100 percent of new cases.
The Omicron sublineage XBB.1.5 dominates at 69 percent, down from 87 percent during the last fortnight, from March 12 to 25, which had been increasing steadily from 39 percent for the twelve weeks prior.
The fastest growing sublineages is XBB, at 29 percent in the most recent fortnight, which had been at 8 percent for the previous two fortnights. Another 2 percent were BQ.1.1., down from 8 percent 4 weeks ago.
The other sublineages — BA.2, BA.5, and BQ.1 — now make up 0 percent of new cases.
Nationwide, according to the CDC, from April 9 to 15, the XBB.1.5 sublineage still dominates at 78 percent of new cases. But its percentage declined from 88 percent of new cases for the two previous weeks after steadily rising from 49 percent twelve weeks ago.
This is followed by XBB.1.16, a newcomer, at 7 percent; XBB.1.9.1, at 7 percent, up from 5 percent for the last two weeks; XBB.1.5.1, still at 2 percent; another newcomer, FD.2, at 2 percent; and BQ.1.1, which made up 3 percent of new cases three weeks ago, again at 1 percent.
Meanwhile, in our region, which includes New York, New Jersey, the Virgin Islands, and Puerto Rico, 78 percent of new cases are, as nationwide, caused by the XBB.1.5 sublineage of Omicron; the percentage had grown steadily to 99 three weeks ago but then began declining, to 90 last week.
Also in our region, XBB.1.16 makes up 9 percent of new cases followed by XBB.1.9.1, at 6 percent, which was 4 percent last week and 3 percent the week before.
Next in our region, unlike nationally, is XBB.9.2 at 3 percent of new cases followed by XBB.1.5.1, which continues at 3 percent.
Although figures on infection rates are no longer reliable since tracing and tracking systems have been disbanded, the state dashboard shows that cases in Albany County as well as statewide have continued to decline in recent weeks.
Three months ago, rates for both the state and county had jumped after having leveled off in November following two months of climbing.
Albany County, as a seven-day average, now has 2.0 cases per 100,000 of population, down from 3.1 last week, 4.0 two weeks ago, 5.2 three weeks ago, 4.1 four weeks ago, 6.5 five weeks ago and 8.7 six weeks ago, which has been in a more or less steady decline from 12.4 fourteen weeks ago.
Numbers hovered between 8 and 11 before that, which was a fairly steady decrease from 21.8 cases per 100,000 thirty-one weeks ago.
This compares with 3.1 cases per 100,000 statewide, down from 3.5 last week, 4.4 two weeks ago, 5.1 three weeks ago, and markedly down over the last month-and-a-half in the twenties following a fairly steady decrease from 30.03 per 100,000 of population five months ago.
The lowest rates are in New York City at 2.5 per 100,000 or population with the Capital Region a close second at 2.6.
The highest count is still in the Finger Lakes at 4.6 this week, which is down from last week’s 5.1 cases per 100,000 as a seven-day average, and further down from 8.3 three weeks ago for the Finger Lakes.
The numbers for vaccination in Albany County have hardly budged for several months. The state’s dashboard now reports on these two categories:
— People with a primary series, for those who have completed the recommended initial series of a given COVID-19 vaccine product — two doses of Pfizer or Moderna vaccine or one dose of Johnson & Johnson vaccine; and
— People who are up to date, for those who have completed all COVID-19 vaccinations, including the bivalent booster, as appropriate per age and clinical recommendations.
As of Tuesday, 21.9 percent percent of Albany County residents were up to date on vaccines, the same as last week but a gradual increase from 17.9 eighteen weeks ago, as opposed to the 61.5 percent of eligible residents who had received booster shots, as reported in prior weeks.
At the same time, 76.3 percent of county residents have completed a primary series, nearly the same as the last several months.
This compares with 76.5 percent of New Yorkers statewide completing a vaccination series, and 14.3 percent being up to date with vaccinations, up from 10.6 eighteen weeks ago.
New Yorkers are still being encouraged by the state’s health department to get bivalent COVID-19 vaccine boosters from Pfizer-BioNTech for anyone age 5 or older and from Moderna for those 6 or older.
To schedule an appointment for a booster, New Yorkers are to contact their local pharmacy, county health department, or healthcare provider; visit vaccines.gov; text their ZIP code to 438829, or call 1-800-232-0233 to find nearby locations.