Week CXLIV: Comptroller: Hardship predated pandemic, 14% of New Yorkers live in poverty
ALBANY COUNTY — This week, State Comptroller Thomas DiNapoli issued a report — “New Yorkers in Need,” the first in a series — showing a larger percentage of New Yorkers live in poverty than the nationwide average. And New Yorkers of color live in poverty at twice the rate of white New Yorkers.
“In New York, the pandemic and ensuing economic shutdown produced almost 2 million job losses in 2020,” DiNapoli writes in introductory comments to his report. “Yet for many, economic hardships existed long before this time; the pandemic deepened the financial stress experienced by these households, fracturing the delicate balance often necessary to make ends meet.
“Even as jobs have returned, rising costs during a high inflationary period have also placed pressure on budgets, particularly for essentials like food and housing.”
Poverty rates in New York State have been higher than the national average since 2014. In 2021, the most recent year with available data, 13.9 percent of New Yorkers lived in poverty — 2.7 million people — compared to 12.8 percent nationwide.
In 17 counties and in the state’s biggest cities, poverty rates top 13 percent.
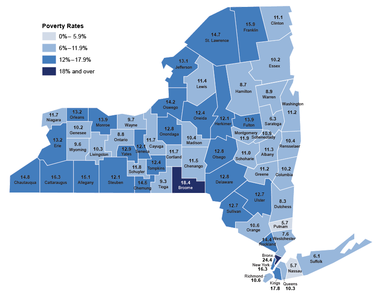
For 2020, Albany County had a poverty rate below both the state and national averages — at 11.3 percent.
From 2010 to 2021, the city of Albany has had poverty levels that range between 20 and 30 percent. This puts Albany in a better position than Syracuse, Rochester, and Buffalo but in a worse position than New York City and Yonkers.
Surrounding counties — Greene, Columbia, Rensselaer, Schoharie, and Schenectady counties — had similar rates to Albany County, in the 10- to 12-percent range in 2010, with the notable exception of Saratoga County, to the north of Albany County, with a poverty rate of 6.5 percent.
The report has a chart, noting the poverty rate for each New York County from 2010 to 2020. Albany County, in 2010, had a poverty rate of 13.2 percent when the state had a rate of 15 percent and the nation had a rate of 15.3 percent.
The rate in Albany County rose as high as 13.8 percent in 2012 and then slowly began a steady decline, to 11.3 percent in 2017 and 2018. It then jumped to 11.7 percent in 2019 before returning to 11.3 percent in 2020.
That ranked Albany County 36th among the 62 counties in New York State.
Albany County is ranked 50th of 62 counties for the poverty rate of people under 18, which is 12.5 percent for 2020.
The causes and effects of poverty are dynamic and can be brought on by a range of different experiences, the reports says, such as physical and mental health problems, economic losses, and traumatic family situations. For some, poverty is temporary; for others, poverty is long-term and potentially multigenerational.
Some groups statewide have persistently high rates: children, women who head households, Black, Hispanic, American Indian, and Pacific Islanders; people with disabilities; and those with less than a high school education.
Poverty rates are much higher for children than for adults, including seniors; however, poverty rates have increased for seniors while decreasing for all others between 2010 and 2021.
For children in particular, the report says, research shows that childhood poverty presents barriers to healthy child development. The financial hardships faced by parents can often result in less access to healthy food and quality medical care, as well as chronic stress in the family, impacting a child’s cognitive development and ultimately the child’s ability to thrive independently as an adult.
Families with female heads of household experience poverty at more than two times the rate of all families and four times the rate of married couples.
Black, Native Hawaiian and Other Pacific Islander, and American Indian New Yorkers experience poverty at twice the rate of white New Yorkers, 20 percent or more compared to 10 percent, respectively, in 2021. Similarly, poverty rates are more than double for Hispanic New Yorkers compared to white, non-Hispanics.
More than one in four of those with less than a high school degree experience poverty, a rate about five times greater than those with college degrees.
One in five New Yorkers in poverty has a disability: 20.4 percent of New Yorkers below the poverty line were disabled in 2021, compared to 12 percent with a disability in the population.
One-quarter of New York’s population below the poverty level in 2021 was foreign born compared to 15 percent nationwide.
New York ranked 13th among all states and had a higher rate of people in poverty than neighboring states and most large states.
The Official Poverty Measure is determined by the United States Census Bureau based on survey data of income and family size and composition, compared to thresholds that reflect the dollar amount required to meet the needs for different sized families.
Income is defined before taxes, not including non-cash benefits such as Medicaid or food stamps. In 2021, the threshold, updated for inflation, was $13,788 for one person and $27,740 for a household of four.
Alternative measures of poverty show greater numbers of households in need, the report says. For example, close to one-third of all households surveyed by the Census Bureau during the pandemic reported at least some difficulty in August 2020 in paying household expenses.
The share increased over the next three months to 40 percent and remained elevated through mid-March 2021. Difficulty in paying for household expenses started increasing again by September 2021 and continued to rise through 2022. In October 2022, this rate was close to half — 47.1 percent — in New York.
“New York has a robust safety net, and recently set a laudable goal to reduce child poverty by 50 percent,” writes DiNapoli. “As the State considers evidence-based approaches to achieve this objective, it should sustain a cross-agency focus on high-needs groups and places where the needs are both chronic and acute.
“Committing to an equitable recovery and targeting resources to those who most need them can facilitate improvements in the lives of millions of New Yorkers.”
Albany County COVID numbers
For the second week in a row, Albany County has been designated by the Centers for Disease Control and Prevention as having a “low” community level of COVID-19. This follows four weeks of being labeled “medium” after 13 weeks of being labeled “high.”
This week, Albany County’s 144th of dealing with the coronavirus, two new COVID-related deaths were reported by the governor’s office on Tuesday. The county’s dashboard, as of Tuesday, Dec. 6, still shows a death toll of 602: 291 males and 311 females.
The weekly metrics the CDC used to determine the current “low” level are:
— Albany County now has a case rate of about 90 per 100,000 of population, up from 69 last week, 51 two weeks ago, and 76 three weeks ago but down from 104 four weeks ago;
— The county has a COVID hospital admission rate of 8.2 per 100,000, down from 9.1 last week about about 14.6 per 100,000 for the two weeks prior; and
— The county has 5 percent of its staffed hospital beds filled with COVID patients, down slightly from 5.1 last week, 5.2 two weeks ago, 5.7 three weeks ago, and 6.3 four weeks ago.
Nationwide, 9 percent of counties are now labeled “high,” up from 6 percent last week and 4 percent the week before while about 35 percent are “medium,” up from 25 percent last week and 18 percent the week before, and about 56 percent are “low,” down from 69 last week and 78 percent the week before.
In New York State, most of the counties are labeled “low,” followed by “medium.” Counties on Long Island and in New York City have “high” designations as do Tioga, Broome, Westchester, and Rockland counties.
As of Dec. 13, according to Albany County’s COVID dashboard, 24 patients were hospitalized with COVID. The county has removed from its website its years-long graphs, including the one charting hospitalizations per 100,000 of population.
As of Nov. 30, the seven-day average for hospitalized COVID patients was 19.29, continuing a downward trend from 36.43 a month ago. Twelve weeks ago, the county’s seven-day average for hospitalized residents was 15.14.
About 47.4 percent of the Capital Region residents hospitalized with COVID this week were not admitted because of having the virus, according to a chart from the governor’s office; that’s up from 32.7 last week.
Although figures on infection rates are no longer reliable since tracing and tracking systems have been disbanded, the state dashboard shows that cases statewide and in Albany County are continuing to level off as they started to in November following two months of climbing.
Albany County, as a seven-day average, now has 10.9 cases per 100,000 of population, down from 13.5 last week but up from 8.6 two weeks ago, 8.0 three weeks ago, and 10.6 four weeks ago but down from 15.2 five weeks ago, which was a fairly steady decrease from 21.8 cases per 100,000 eighteen weeks ago.
This compares with 27.8 cases per 100,000 statewide, which down slightly from 28.5 last week but up from 18.4 two weeks ago, 19.0 three weeks ago, 18.8 four weeks ago, and 20.9 five weeks ago, which was another fairly steady decrease from and from 30.03 per 100,000 of population 15 weeks ago.
The lowest rates are in Western New York at 10.24 cases per 100,000, which is up from last week’s Central New York low of 9.3 cases per 100,000 population, up from 6.58 the week before.
The highest count is still on Long Island at 42.77, down from 44.7 last week, which was a dramatic jump from 23.93 the week before.
The numbers for vaccination in Albany County have hardly budged for several months. The state’s dashboard last week changed its reporting criteria and now reports on these two categories:
— People with a primary series, for those who have completed the recommended initial series of a given COVID-19 vaccine product — two doses of Pfizer or Moderna vaccine or one dose of Johnson & Johnson vaccine; and
— People who are up to date, for those who have completed all COVID-19 vaccinations, including the bivalent booster, as appropriate per age and clinical recommendations.
As of Tuesday, just 17.9 percent of Albany County residents were up to date on vaccines, up from 17.2 percent last week, as opposed to the 61.5 percent of eligible residents who had received booster shots, as reported in prior weeks.
At the same time, 76 percent of county residents have completed a primary series, up slightly from the 75.5 percent reported previously.
This compares with 76.2 percent of New Yorkers statewide completing a vaccination series, up slightly from 76.1 percent last week, and 11.1 percent being up to date with vaccinations up from 10.6 last week.
The shift in the prevalence of Omicron sublineages has continued this week.
The once-dominant BA.5 now makes up about 12 percent of new COVID cases nationwide, with BQ.1.1 at about 37 percent and BQ.1 at about 31 percent.
In Region 2 — New York, New Jersey, Puerto Rico, and the Virgin Islands — the spread of the new sublineages is even more pronounced.
For the week between Dec. 4 and 10, BA.5 now makes up just roughly 10 percent of the cases while BQ.1 is now dominant at roughly 37 percent followed by BQ.1.1 at 36 percent.
XBB is fourth at 7 percent followed by BF.7, which makes up 3 percent; the other sublineages each make up 3 percent or less.
The bivalent booster shot was designed to combat BA.4, which is now almost nonexistent, and BA.5 — and so may still be effective against its similarly highly contagious descendants.
New Yorkers are being encouraged by the state’s health department to get bivalent COVID-19 vaccine boosters from Pfizer-BioNTech for anyone age 5 or older and from Moderna for those 6 or older.
To schedule an appointment for a booster, New Yorkers are to contact their local pharmacy, county health department, or healthcare provider; visit vaccines.gov; text their ZIP code to 438829, or call 1-800-232-0233 to find nearby locations.


