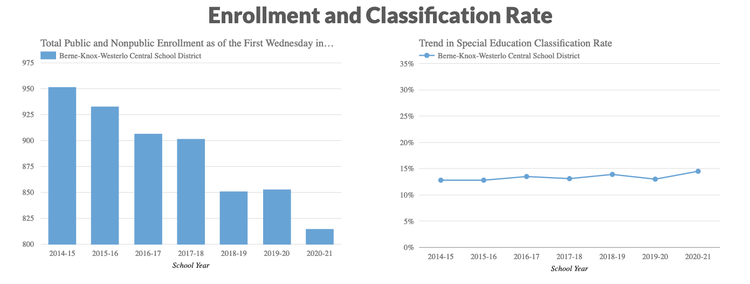
— Graph from the New York State Department of Education
The graph on the left shows the total enrollment at Berne-Knox-Westerlo from 2014 through the 2020-21 school year while the chart on right shows the percentage of students receiving special education over the same period.