Week CLX: COVID-induced expansion of Medicaid coverage ends
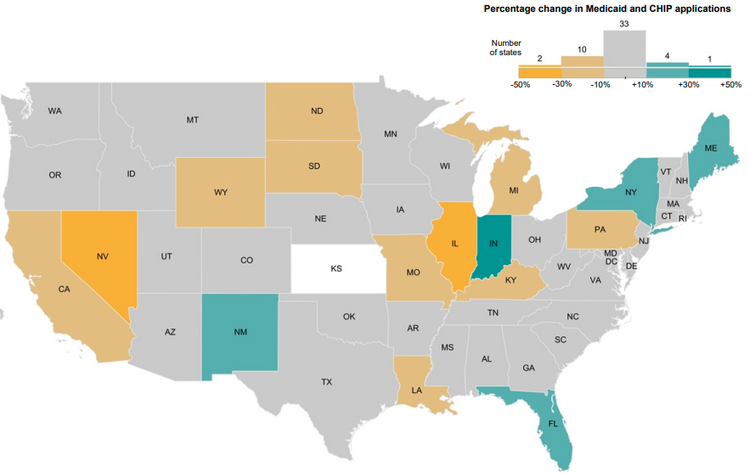
— Map from CMS Performance Indicator Data
The change in Medicaid and Children’s Health Insurance Program applications submitted directly to states, from November 2022 to December 2022, shows that New York was one of four states where applications increased by 10 to 30 percent. In Indiana, applications increased by more than 30 percent.
ALBANY COUNTY — This week marked the expiration of extended medical coverage for people who couldn’t afford insurance.
The emergency measures Congress adopted in the midst of the pandemic to require Medicaid payments expired on April 1.
The nation’s uninsured rate declined to a historic low of 8 percent in the first quarter of 2022, partly due to the continuous enrollment provision in Medicaid as well as strong enrollment outreach efforts and expanded Marketplace subsidies under the American Rescue Plan, according to a brief from the Office of Health Policy of the the Department of Health and Human Services.
Between February 2020, before the start of the pandemic, and December 2021, Medicaid enrollment grew by approximately 15.5 million people, from 71.2 million to 86.7 million, a nearly 22 percent increase, the brief says.
People must now meet the income eligibility requirements for Medicaid that were set before the pandemic.
New York state initiated renewals in March, and July is the month when terminations are first expected, according to a chart for all 50 states produced by the Kaiser Family Foundation, which estimates it will take 12 to 14 months to complete all renewals in New York state.
New York is using a time-based approach for prioritizing renewals and is not flagging enrollees who may no longer be eligible.
The federal Department of Health and Human Services estimates that as many as 15 million Americans may lose their insurance, but many may be eligible for other forms of insurance.
The Families First Coronavirus Response Act, passed at the start of the pandemic in March 2020, kept states from ending Medicaid coverage, which grew to more than 85 million people — an increase of 25 percent from February 2020, according to a report from the Centers for Medicare & Medicaid Services, known as CMS.
Since February 2020, the CMS “snapshot” says, enrollment in Medicaid and the Children’s Health Insurance Program, known as CHIP, increased by 22 million people or nearly 31 percent. Medicaid enrollment increased by 21 million people or 34 percent while CHIP enrollment increased by 215,350 people or 3 percent.
“The Medicaid enrollment increases are likely driven by COVID-19 and the continuous enrollment condition in the Families First Coronavirus Response Act,” the report says.
According to a document from Daniel Tsai, deputy administrator and director for CMS, states have up to a year to decide which people are still eligible for Medicaid and states have 14 months to renew or terminate their benefits.
Among the 15 million Medicaid and CHIP enrollees expected to lose coverage, children and young adults will be impacted disproportionately, with 5.3 million children and 4.7 million adults ages 18 to 34 predicted to lose Medicaid/CHIP coverage, according to a policy document from the Health and Human Services Office of the Assistant Secretary for Planning and Evaluation.
Nearly one-third of those predicted to lose coverage are Latino (4.6 million) and 15 percent (2.2 million) are Black, the policy document says.
The document also says, “Almost one-third (2.7 million) of those predicted to lose eligibility are expected to qualify for Marketplace premium tax credits. Among these individuals, over 60 percent (1.7 million) are expected to be eligible for zero-premium Marketplace plans under the provisions of the American Rescue Plan (ARP). Another 5 million would be expected to obtain other coverage, primarily employer-sponsored insurance.”
However, an estimated 383,000 people projected to lose eligibility for Medicaid “would fall in the coverage gap in the remaining 12 non-expansion states — with incomes too high for Medicaid, but too low to receive Marketplace tax credits,” says the document, “Unwinding the Medicaid Continuous Enrollment Provision,” which was released in August 2022.
As of March 27, KFF maps 10 states that have not adopted Medicaid expansion: Wyoming, Wisconsin, Kansas, Texas, Mississippi, Tennessee, Alabama, Georgia, South Carolina, and Florida.
The Affordable Care Act’s Medicaid expansion allowed coverage for nearly all adults with incomes up to 138 percent of the Federal Poverty Level ($20,120 for an individual in 2023) and provided states with an enhanced federal matching rate for their expansion populations. New York is among the states that have adopted and implemented the Medicaid expansion.
A special enrollment period has been set up by Health and Human Services to help people who lose Medicaid between March 31, 2023 and July 31, 2024, move to the Obamacare marketplace: https://www.healthcare.gov/.
Albany County COVID numbers
For the second week in a row, Albany County has been designated by the Centers for Disease Control and Prevention as having a “low” community level of COVID-19.
This follows two months of being labeled “medium,” which followed a month with a “high” designation after just two weeks at “low” preceded by a month of “medium” after 13 weeks of being labeled “high.”
This week, 55 of New York’s 62 counties are, like Albany, designated as having a “low” community level. Three counties near the Pennsylvania border — Steuben, Chemung, and Schuyler — are designated as “high” while four other western New York counties are labeled “medium”: Yates, Ontario, Seneca, and Wayne counties.
Nationwide, following a positive trend over the last two months, less than 1 percent of counties are labeled “high” while 9 percent, up from 6 percent last week, are “medium,” and the great majority — 90.5 percent, down from 93 percent last week — are labeled “low.”
The weekly metrics the CDC used to determine the current “low” level for Albany County are:
— Albany County now has a case rate of about 35 per 100,000 of population, up from 30 last week but a drop from 42 two weeks ago, and a steady decrease from 120 ten weeks ago;
— For the important COVID hospital admission rate, Albany County has a rate of 5.6 per 100,000, down from 9.6 last week and dramatically down from more than triple that, 22.2, ten weeks ago; and
— Albany County now has 4.3 percent of its staffed hospital beds filled with COVID patients, down from 5.1 last week, hovering near the same mark for about a month, although down from the percentages for the previous nine weeks, which ranged from 6 to 8.
This week, Albany County’s 160th of dealing with COVID, numbers are continuing in the right direction with fewer new cases documented. The same is true statewide and nationwide.
Last week, the governor’s office stopped sending daily press releases on COVID-19 counts, which had included deaths, listed by county.
Albany County’s dashboard, as of Tuesday, April 4, showed a death toll of 633, which was one more male, at 304, and two more females, at 329, than last week.
Also as of April 4, according to Albany County’s COVID dashboard, 16 patients were hospitalized with COVID, down from 22 last week, 26 two weeks ago, 30 three weeks ago and 31 patients the week before, which was down from 39 five weeks ago, near the same mark for a month but down from 42 nine weeks ago, 43 ten weeks ago, and 46 eleven weeks ago.
In New York state, according to the health department’s most recent figures, for samples collected between March 12 and 25, the Omicron variant continued to make up 100 percent of new cases.
The Omicron sublineage XBB.1.5 dominates at 87 percent, up from 79 percent in the last fortnight, Feb. 26 and March 11, which had been increasing from 39 percent for the eight weeks prior; 8 percent were still XBB, while another 3 percent were BQ.1.1., down from 8 percent during the previous fortnight. The other sublineages made up less than 3 percent of new cases.
Nationwide, according to the CDC, from March 26 to April 1, the XBB.1.5 sublineage made up 88 percent of new cases, down 2 percentage points from last week, which had been steadily rising from 49 percent ten weeks ago.
This is followed by XBB.1.9.1, at 5 percent, up from 3 percent last week, XBB at 3 percent, and XBB.1.5.1 still at 2 percent. BQ.1.1, which made up 3 percent of new cases last week, is now at less than 2 percent.
Meanwhile, in our region, which includes New York, New Jersey, the Virgin Islands, and Puerto Rico, 91 percent of new cases are caused by the XBB.1.5 sublineage of Omicron; the percentage had grown steadily to 99 two weeks ago but has declined slightly from 94 last week.
Also in our region, XBB.1.5.1 continues at 3 percent of new cases followed by XBB.1.9.1, also at 3 percent, and XBB at 2 percent.
Although figures on infection rates are no longer reliable since tracing and tracking systems have been disbanded, the state dashboard shows that cases in Albany County as well as statewide have continued to decline in recent weeks.
Three months ago, rates for both the state and county had jumped after having leveled off in November following two months of climbing.
Albany County, as a seven-day average, has 4.0 cases per 100,000 of population, down from 5.2 last week, about the same as 4.1 two weeks ago, but down from 6.5 three weeks ago and 8.7 four weeks ago, which has been in a more or less steady decline from 12.4 twelve weeks ago.
Numbers hovered between 8 and 11 before that, which was a fairly steady decrease from 21.8 cases per 100,000 twenty-nine weeks ago.
This compares with 4.4 cases per 100,000 statewide, down from last week’s 5.1 and markedly down over the last month-and-a-half in the twenties following a fairly steady decrease from 30.03 per 100,000 of population five months ago.
The lowest rates are still in the Mohawk Valley at 3.1 per 100,000 or population, which is down from 4.1 last week.
The highest count is in the Finger Lakes at 6.0 cases per 100,000 as a seven-day average, which is down from last week’s 8.3 for the Finger Lakes.
The numbers for vaccination in Albany County have hardly budged for several months. The state’s dashboard now reports on these two categories:
— People with a primary series, for those who have completed the recommended initial series of a given COVID-19 vaccine product — two doses of Pfizer or Moderna vaccine or one dose of Johnson & Johnson vaccine; and
— People who are up to date, for those who have completed all COVID-19 vaccinations, including the bivalent booster, as appropriate per age and clinical recommendations.
As of Tuesday, 21.8 percent percent of Albany County residents were up to date on vaccines, a gradual increase from 17.9 sixteen weeks ago, as opposed to the 61.5 percent of eligible residents who had received booster shots, as reported in prior weeks.
At the same time, 76.3 percent of county residents have completed a primary series, nearly the same as the last several months.
This compares with 76.5 percent of New Yorkers statewide completing a vaccination series, and 14.2 percent being up to date with vaccinations, up from 10.6 sixteen weeks ago.
New Yorkers are still being encouraged by the state’s health department to get bivalent COVID-19 vaccine boosters from Pfizer-BioNTech for anyone age 5 or older and from Moderna for those 6 or older.
To schedule an appointment for a booster, New Yorkers are to contact their local pharmacy, county health department, or healthcare provider; visit vaccines.gov; text their ZIP code to 438829, or call 1-800-232-0233 to find nearby locations.