Week CLVI: Federal pandemic help ends, leaving local food pantries in the lurch
Enterprise file photo — Michael Koff
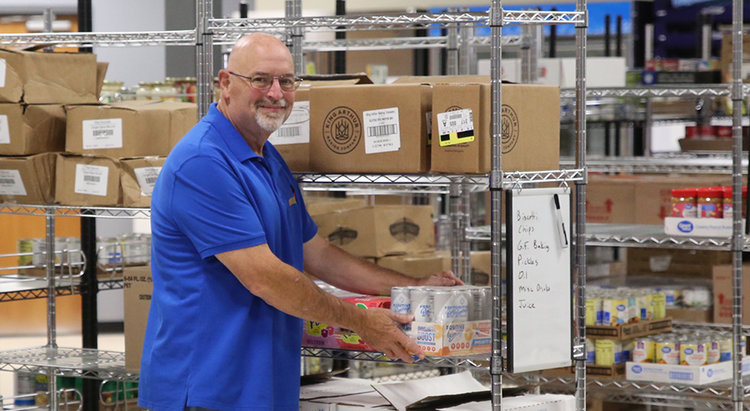
John McDonnell stocks shelves at the Guilderland Food Pantry.
ALBANY COUNTY — Food insecurity across New York state declined during the pandemic because of federal funds but on March 1, the added allotments for food stamp recipients ended.
Coupled with inflation, the end of the emergency allotments for the Supplemental Nutrition Assistance Program, known as SNAP, formerly as food stamps, has put pressure on local food pantries.
The average SNAP benefits will fall to a meager $6 a person a day, according to a release earlier this week from The Food Pantries for the Capital District; the steepest decrease will be for older adults at the minimum level.
One in nine people in Guilderland is food insecure, John McDonnell, director of the Guilderland Food Pantry, told The Enterprise last fall, and the number has grown during the pandemic in what he called “the perfect storm.”
Prices for food, utilities, and gas are all increasing, McDonnell said. “And we’ve lost all of the COVID monies.” Day-care centers have closed or increased markedly in price, he said. Grown children are moving back in with their parents, grandparents are caring for their grandchildren so parents can work.
The federal government, after two years of providing free lunches for every student, has returned to the original system of providing lunches for families deemed poor. McDonnell says that almost 20 percent of school-age children in Guilderland qualify for free or reduced-price lunches.
Use of the Guilderland pantry increased 55 percent from the summer of 2021 to the summer of 2022. In 2021, the pantry provided under 21,000 meals; in 2022, it provided over 36,000.
Natasha Pernicka, director of The Food Pantries for the Capital District, said more than 80 percent of food-pantry members reported increased service levels in 2022, with 45 percent not feeling that they have adequate funding to provide services to their community.
“Inflation is not only driving increased service to community members in need,” she said in this week’s release, “but is also impacting food pantry operations to keep shelves stocked. Our fuel expense to distribute food nearly doubled in 2022.”
Pernicka said of the end of the federal emergency allotment for SNAP recipients, “The ending of SNAP-EA comes at the worst possible time for our community, and our food pantry system. Capital Region food pantries are experiencing all-time high service levels, with a 34-percent increase in the number of people seeking assistance in 2022. We want people to know that food pantries are here for you if you are struggling to make ends meet. “
During COVID, The Food Pantries for the Capital District developed the Food Connect Map to help people seeking food assistance across the state. This is a link to the map, marking food pantries and community meals: https://thefoodpantries.org/how-to-find-food-assistance/find-food-now/.
Comptroller’s report
About 1 in 10, or about 800,000, New York households experienced food insecurity at some point between 2019 and 2021, according to a report the state’s comptroller, Thomas DiNapoli, released on March 1. This is his second report on issues affecting New Yorkers in need; the first report examined poverty trends.
“Federal aid helped New Yorkers put food on the table during the pandemic, but some relief programs are ending as inflation and other pressures are pushing household budgets to their limit,” DiNapoli said in a statement, releasing the report. “With all the challenges people are facing during these difficult times, we should ensure New Yorkers don’t go hungry. Our nation’s nutrition programs should be expanded to help those who are struggling to feed themselves and their families.”
Systematic or chronic lack of access to food is commonly referred to as hunger; however, the report notes, government definitions center on the concepts of food security and insecurity.
The United States Department of Agriculture defines “food security” as access by household members to enough food for an active, healthy life. It defines “food insecurity” as households unable at times to acquire adequate food for one or more household members because they had insufficient money and other resources for food. Research indicates food insecurity can affect health and mental-health outcomes, academic performance, and workforce productivity.
National rates of food insecurity in 2021 were highest for households headed by single mothers at 24.3 percent, as well as households headed by African Americans at 19.8 percent, and Hispanics at 16.2 percent.
The 1-in-10 household food insecurity between 2019 and 2021 for New Yorkers was 4.1 percentage points lower than the peak of 14.4 percent recorded in the 2012 to 2014 period, the comptroller’s report says.
Food insecurity in New York and nationwide has continued trending downward even through the COVID pandemic due to temporary pandemic relief programs that enhanced income, such as economic impact payments and expansion of the federal Child Tax Credit, and other programs that increased assistance available through federal nutrition programs
In addition, New York state expanded its funding for food programs through initiatives such as the Nourish New York program.
Since federal support has stopped and, at the same time, inflation has increased food prices, food insecurity is rising.
Census survey data shows more New Yorkers are reporting they do not have enough food to eat, which is known as “food insufficiency.” In the summer of 2021, 7.3 percent of New Yorkers reported food insufficiency; by November 2022, that rate grew to 10.8 percent of New Yorkers. Rates for households with children increased to 13.4 percent.
As of December 2022, nearly 2.9 million New York households were enrolled in SNAP, which ended its emergency allotments on March 1.
Also, increased benefits provided by the Special Supplemental Nutrition Program for Women, Infants and Children, known as WIC, will cease in October 2023.
Food insecurity could grow further, the comptroller’s reports says, when these allotments end, and when other temporary flexibilities and program expansions that have supported many households during the pandemic expire.
The comptroller’s report also delineates several barriers to people obtaining nutritional food.
The report cites a survey that found 62 percent of food-insecure individuals reported transportation is a barrier to obtaining food and notes, “These challenges can be acute for those in rural areas or those who are disabled.”
The Guilderland Food Pantry in 2021 delivered food to about 25 percent of its clients; in 2022, that jumped to about 40 percent getting home deliveries.
“A lot of those folks are seniors — they don’t drive, can’t drive, don’t have vehicles,” said McDonnell. “Some of the others are single parents at home with kids.”
Access is another challenge. The comptroller’s report cites a different survey that shows three in five food-insecure adults who reported not using charitable food services were not aware of resources in their community, and about half of low-income adults surveyed reported feeling uncomfortable seeking assistance if they had a need.
McDonnell said the Guilderland Food Pantry works hard to make clients feel OK about accepting help. “The bottom line for me is, we have folks in our community who are struggling — and they may not struggle forever …,” he said. “We need to encourage people that need help … We need to encourage people to not be afraid, not be intimidated by the process … All you have to do is call me and you’ll get food ….”
A third barrier outlined in the comptroller’s report is not access to food, but access to nutritional food. In times of rising food prices, households may shift their purchases toward more affordable items while simultaneously reducing the nutritional quality of food.
Nutrition security is defined by the USDA as “consistent access, availability, and affordability of foods and beverages that promote well-being and prevent (and if needed, treat) disease.”
A Health Foundation survey cited in the report found food-insecure New Yorkers are twice as likely to report poor or fair health as their food-secure peers (48 percent compared with 23 percent), 21 percent delay or skip medical care, and 13 percent delay or do not purchase prescription medication.
Recommendations
DiNapoli had some of the same recommendations as Pernicka with The Food Pantries for the Capital District.
Both called for expansion of the federal SNAP and WIC programs with the comptroller adding, “Recent Congressional action to create a permanent summer food program for eligible children starting in 2024 is a notable advancement.”
Pernicka’s group also called for providing free healthy school breakfasts and lunches to all students, providing SNAP benefits to immigrants and to the working poor who are not eligible at a federal level, and providing free home delivery of groceries purchased with SNAP or WIC online to people who have transportation or other access barriers.
At the state level, The Food Pantries for the Capital District called for increasing funding for the Hunger Prevention and Nutrition Assistance Program to $63 million and increasing funding for Nourish New York to $75 million. DiNapoli, too, calls for further funding for state nutritional programs.
The comptroller’s other recommendations are to:
— Renew the federal Child Tax Credit expansion, noting that recipients reported greater declines in food insecurity than non-recipients, underscoring the interrelatedness of social safety net policies. “Federal Child Tax Credit enhancements should be renewed so meaningful reductions in poverty can continue and stress on household budgets is alleviated,” the report says;
— Implement the White House strategy on Hunger, Nutrition and Health, which has a goal of cutting food insecurity in half and virtually eliminating the number of U.S. households experiencing hunger by 2030;
— Improve access by having state agencies ramp up outreach activities to increase participation in SNAP and WIC, and make it easier to apply and recertify; and
— Continue to pursue innovative approaches, including expansion of medically tailored meals provided by Medicaid, subsidizing the costs of online food delivery, and providing incentives to bring grocery stores and healthy food to food deserts.
Albany County COVID numbers
This week, Albany County’s 156th of dealing with COVID, and coming close to its third year — the first confirmed case in the county was on March 20, 2020 — numbers are continuing in the right direction with fewer new cases documented. The same is true statewide and nationwide.
Five new COVID-related deaths in Albany County were reported this week by the governor’s office: two were reported on Wednesday, March 1; another on Friday, March 3; and two more deaths were reported on Tuesday, March 7.
The county’s dashboard, as of Tuesday, March 7, showed a death toll of 625: 301 males and 324 females.
Also this week, Albany County’s designation by the Centers for Disease Control and Prevention has remained at a “medium” community level of COVID-19 after being labeled “high” six weeks ago.
The county had been designated “medium” by the CDC for the four weeks prior to the “high” designation, which followed two weeks of a “low” designation. That was preceded by four weeks of being labeled “medium” after 13 weeks of being labeled “high.”
For the last two weeks, all of the counties in New York state had been designated as either “low” or “medium,” but this week, four counties — Wayne, Ontario, Yates, and Seneca counties, all in the Finger Lakes region — are labeled “high.”
All of the counties surrounding Albany are still designated “low” except for Rensselaer County, which is also labeled “medium.”
Nationwide, similar to the last three weeks, only 2 percent of counties are labeled “high” while 16 percent are “medium,” and the great majority — 82 percent — are labeled “low.”
The weekly metrics the CDC used to determine the current “medium” level for Albany County are:
— Albany County now has a case rate of about 60 per 100,000 of population, another drastic drop from last week’s 70, and 77 and 94 in the weeks before, down from 99 four weeks ago, 102 five weeks ago, 120 six weeks ago, 107 seven weeks ago, and 79 eight weeks ago;
— For the important COVID hospital admission rate, Albany County has a rate of 18.4 per 100,000, an increase form last week’s 14.8 and 17.4 two weeks ago, but down from 18.6 three weeks ago, although up from 15.4 four weeks ago, 16.4 five weeks ago, down from 22.2 six weeks ago, and up from 16 seven weeks ago; and
— Albany County now has 5.9 percent of its staffed hospital beds filled with COVID patients, up slightly from 5.7 last week, the same as two weeks ago, down from 6.4 three weeks ago but up slightly from 5.6 four weeks ago, although down from the percentages for the previous seven weeks, which ranged from 6 to 8.
As of March 7, according to Albany County’s COVID dashboard, 31 patients were hospitalized with COVID, down from 39 last week, and the same as two weeks ago, which was in the same range as for the three previous weeks but down from 42 six weeks ago, 43 seven weeks ago, and 46 eight weeks ago.
About 38 percent of the Capital Region residents hospitalized with COVID this week were not admitted because of having the virus, according to a chart from the governor’s office.
In New York State, according to the health department’s most recent figures, for samples collected between Feb. 12 and 25, the Omicron variant again made up close to 100 percent of new cases.
The Omicron sublineage XBB.1.5 dominates at 92 percent, up from 86 percent in the last two-week period, 75 percent in the previous fortnight, and 39 percent in the fortnight before that; 3 percent were XBB while another 2 percent were BQ.1.1. The other sublineages made up less than 1 percent of new cases.
Nationwide, according to the CDC, from Feb. 26 to March 4, the XBB.1.5 sublineage made up 90 percent of new cases, steadily rising from 49 percent six weeks ago, followed by BQ.1.1 at 7 percent and BQ.1 at 2 percent — both in decline.
Meanwhile, in our region, which includes New York, New Jersey, the Virgin Islands, and Puerto Rico, a whopping 99 percent of new cases are caused by the XBB.1.5 sublineage of Omicron, a still-growing percentage, followed by other sublineages at less than 1 percent of new cases.
Although figures on infection rates are no longer reliable since tracing and tracking systems have been disbanded, the state dashboard shows that cases in Albany County as well as statewide have continued to decline in recent weeks.
Nine weeks ago, rates for both the state and county had jumped after having leveled off in November following two months of climbing.
Albany County, as a seven-day average, has 8.7 cases per 100,000 of population, up from 7.8 last week but down from 11.0 for the two weeks prior, and down from 13.9 four weeks ago, 13.6 five weeks ago, 14.7 six weeks ago, 16.2 seven weeks ago, 24.4 eight weeks ago, 12.4 nine weeks ago, 12.0 ten weeks ago, and 10.9 eleven weeks ago.
Numbers hovered between 8 and 11 before that, which was a fairly steady decrease from 21.8 cases per 100,000 twenty-six weeks ago.
This compares with 6.9 cases per 100,000 statewide, down from rates over the last month-and-a-half in the twenties following a fairly steady decrease from 30.03 per 100,000 of population five months ago.
The lowest rates are in places that once were hotspots: New York City has the lowest rate this week at 5.2 cases per 100,000 of population, down from 6.1 last week and 9.5 the week before.
The highest count is still in the North Country at 12.8 per 100,000 of population, which has been around 15 for the last several weeks.
The numbers for vaccination in Albany County have hardly budged for several months. The state’s dashboard now reports on these two categories:
— People with a primary series, for those who have completed the recommended initial series of a given COVID-19 vaccine product — two doses of Pfizer or Moderna vaccine or one dose of Johnson & Johnson vaccine; and
— People who are up to date, for those who have completed all COVID-19 vaccinations, including the bivalent booster, as appropriate per age and clinical recommendations.
As of Tuesday, 21.4 percent percent of Albany County residents were up to date on vaccines, a gradual increase from 17.9 twelve weeks ago, as opposed to the 61.5 percent of eligible residents who had received booster shots, as reported in prior weeks.
At the same time, 76.2 percent of county residents have completed a primary series, nearly the same as the last several weeks.
This compares with 76.5 percent of New Yorkers statewide completing a vaccination series, and 13.9 percent being up to date with vaccinations, up from 10.6 twelve weeks ago.
New Yorkers are being encouraged by the state’s health department to get bivalent COVID-19 vaccine boosters from Pfizer-BioNTech for anyone age 5 or older and from Moderna for those 6 or older.
To schedule an appointment for a booster, New Yorkers are to contact their local pharmacy, county health department, or healthcare provider; visit vaccines.gov; text their ZIP code to 438829, or call 1-800-232-0233 to find nearby locations.