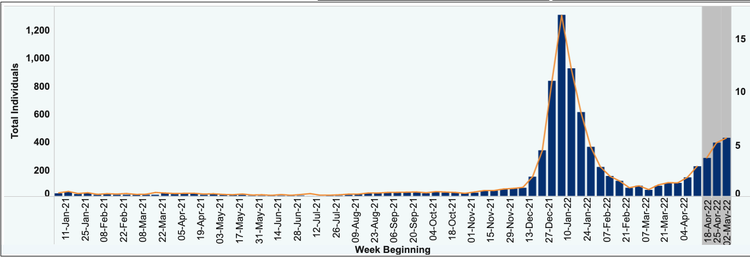
— Graph from NYSDOH
Recently, in the Capital Region, reinfections of COVID-19, represented by the blue bars, have been rising rapidly. The orange line represents the reinfection rate per 100,000.